
By SPIE ICS SA · Reading time: 7 min · May 2026
Digital environmental impact: Why measurement is your first performance lever
The digital environmental footprint accounts for around 2% of the climate footprint of Switzerland, with a strong upward trend. Do you know the real weight of your IT fleet? Without measurement, there is no management.
The digital sector is no longer off the environmental radar. In Switzerland, digital technology already generates around 2% of national greenhouse gas emissions (consumption-based approach), with a strong upward trend driven in particular by the rise of AI and cloud computing and usage. For CIOs and CSR directors at significant organisations, the question is no longer whether IT has an impact, but how to quantify it precisely and turn it into a concrete management tool.
The good news: measuring the digital environmental footprint is now a structured discipline, with recognised methods and benefits that go well beyond regulatory reporting alone.
What is the digital environmental footprint?
The digital environmental footprint refers to all ecological impacts generated by the manufacturing, use and end of life of IT equipment, network infrastructure and data centres. It covers energy consumption and CO₂ emissions, but also resource depletion, electronic waste, and water consumption.
Contrary to popular belief, digital technology is not immaterial. Every device, every server, every data exchange consumes physical resources at every stage of its life cycle. The environmental impact of digital technology is therefore both global (through worldwide supply chains) and local (through electricity consumption and waste generated within organisations).
The carbon footprint alone is no longer enough: the multi-criteria approach that changes the game
Reducing the digital environmental footprint to a simple CO₂ count is like looking at an iceberg and measuring only the tip. A complete analysis covers around fifteen distinct indicators: abiotic resource depletion, acidification, water consumption, electronic waste production… All dimensions that a single-criterion carbon footprint ignores, yet which can represent the bulk of an IT fleet's actual impact.
The limits of the classic IT carbon footprint
The IT carbon footprint is useful for reporting direct CO₂-equivalent emissions. But it says nothing about the use of rare earths in chip manufacturing, the amount of water consumed by data centres, or the electronic waste generated at end of life. For CIOs and CSR directors who must feed a complete ESG report, stopping at carbon means accepting a blind spot on issues that are progressively becoming embedded in regulatory frameworks.
Why a multi-criteria approach?
The multi-criteria approach makes it possible to capture the full scope of impacts. Among the key indicators:
- Greenhouse gas emissions (CO₂ eq.)
- Depletion of abiotic resources (minerals, rare metals)
- Freshwater consumption
- Soil and water acidification
- Primary energy consumption
This level of detail is not an academic luxury. It enables the most effective reduction actions to be identified and prioritised according to each company's specific challenges.
Devices, networks, data centres: where does your IT fleet's impact really hide?
We instinctively think of data centres when talking about digital footprint. The reality is more counter-intuitive. End-user devices concentrate around 66% of an IT fleet's environmental impact in Switzerland, mainly due to their manufacturing. This is the most underestimated source of impact, and paradoxically the one where purchasing and lifecycle decisions have the most direct effect.
The case of digital devices: manufacturing, the primary impact factor
For a standard laptop, around two thirds of its digital carbon footprint is generated before the device is even switched on for the first time. The manufacturing phase consumes rare abiotic resources, uses considerable energy, and produces waste from the very first hours of the product's life. This finding places purchasing decisions at the heart of any digital sobriety strategy.
Data centres and scope 3: a growing share not to be overlooked
Data centres represent a secondary volume of impact, but their visibility is higher because their electricity consumption is directly measurable. For companies that have outsourced their infrastructure to the cloud, part of this impact shifts to scope 3 of their carbon footprint. The emission factor used for the host country's electricity can cause this impact to vary considerably depending on the server location.
What is the environmental footprint and how is it measured?
The environmental footprint is measured through a life cycle assessment (LCA). This method, standardised under ISO 14040/14044, quantifies the impacts of a piece of equipment or system from raw material extraction through to recycling.
Life cycle assessment applied to IT
Applied to an IT fleet, the life cycle assessment produces a device-by-device diagnostic. It covers four phases:
- Manufacturing: raw material extraction, processing, assembly
- Transport and distribution: delivery to the point of use
- Use: electricity consumption over the entire service life
- End of life: dismantling, recycling or landfill
Recognised reference frameworks (such as ADEME, the ecoinvent database, etc.) provide standardised emission factors for each equipment category, enabling reliable comparisons between manufacturers, configurations and usage scenarios. This rigour is what gives footprint measurement its robustness in ESG reporting and in the face of regulatory requirements.
Measure to manage: how a life cycle assessment transforms your IT purchasing decisions
A life cycle assessment does not just produce a report to be filed away. It generates concrete data that changes how decisions are made between renewal and refurbishment, between public cloud and on-premise infrastructure, between one manufacturer and another. When a CIO knows that doubling the lifespan of equipment can reduce its impact by around 50% (TCO Certified, ADEME), this becomes a procurement criterion on a par with total cost of ownership.
From footprint measurement to the ESG dashboard
Data from an LCA integrates directly into IT management and ESG reporting tools. They allow:
- Tracking the evolution of the fleet's environmental performance over time
- Calculating the impact of each purchasing decision before approval
- Automatically feeding regulatory reports (CSRD)
- Comparing scenarios: new vs refurbished equipment, cloud vs on-premise
SPIE relies on its partner Resilio's tool to offer its clients an LCA methodology covering around fifteen indicators. It is this level of granularity that transforms a regulatory constraint into a real competitive advantage.
The underrated lever of refurbished equipment
Opting for certified refurbished equipment significantly reduces the manufacturing impact: doubling the lifespan of a device reduces its footprint by around 50% (TCO Certified, ADEME). For a fleet of 500 workstations renewed over five years, the environmental saving can represent several tens of tonnes of avoided CO₂ equivalent, without any significant impact on operational performance or costs, and often with a direct budget saving.
What a life cycle assessment concretely reveals about your infrastructure
An LCA applied to an IT fleet is not a theoretical abstraction: it produces a precise diagnostic over a defined scope. It identifies the most impactful areas, highlights anomalies (equipment that is too old causing excess electricity consumption, or conversely replaced too quickly increasing manufacturing impact), and provides quantified improvement scenarios.
This is the granularity that makes the difference between defensive CSR reporting and a genuine IT management tool focused on environmental performance.
What is the main component of the digital environmental footprint?
The main component of the digital environmental footprint is the manufacturing of end-user devices (computers, smartphones, screens). It accounts for around 66% of an IT fleet's total impact in Switzerland, ahead of data centre electricity consumption and digital network traffic.
CSRD, Swiss CO₂ Act: why measuring now matters
Environmental reporting frameworks are being tightened across Europe. The CSRD is progressively expanding the scope of companies subject to detailed non-financial reporting. In Switzerland, CO₂ legislation is also moving towards greater transparency for large organisations. Companies that do not yet have reliable data on their digital environmental impact will find themselves building in a rush what their competitors will already have integrated into their processes.
Starting now means turning a regulatory constraint into a competitive advantage: better visibility on the hidden costs of the IT fleet, differentiating arguments in public tenders, and solid foundations for credible, auditable ESG reporting.
FAQ: digital environmental footprint
What is the digital environmental footprint?
The digital environmental footprint refers to all the ecological impacts of digital usage: manufacturing and end-of-life of equipment, electricity consumption during use, network traffic and data centre operation. In Switzerland, this sector accounts for around 2% of national GHG emissions (consumption-based approach), with a strong upward trend driven by the rise of AI and cloud usage.
What is a digital footprint?
An organisation's digital footprint is the sum of all environmental impacts generated by its IT equipment and digital usage. It includes workstations, servers, networks, cloud access and employee practices. Measuring this footprint is the essential starting point for any reduction initiative and any credible environmental reporting.
What is the environmental footprint?
The environmental footprint is a quantitative measure of all the pressures an activity exerts on ecosystems and natural resources. It goes beyond the sole notion of CO₂ by incorporating indicators such as water consumption, land use, depletion of abiotic resources, and waste production. In the IT context, it covers the entire digital life cycle of equipment, from manufacturing to recycling.
What is the main component of the digital environmental footprint?
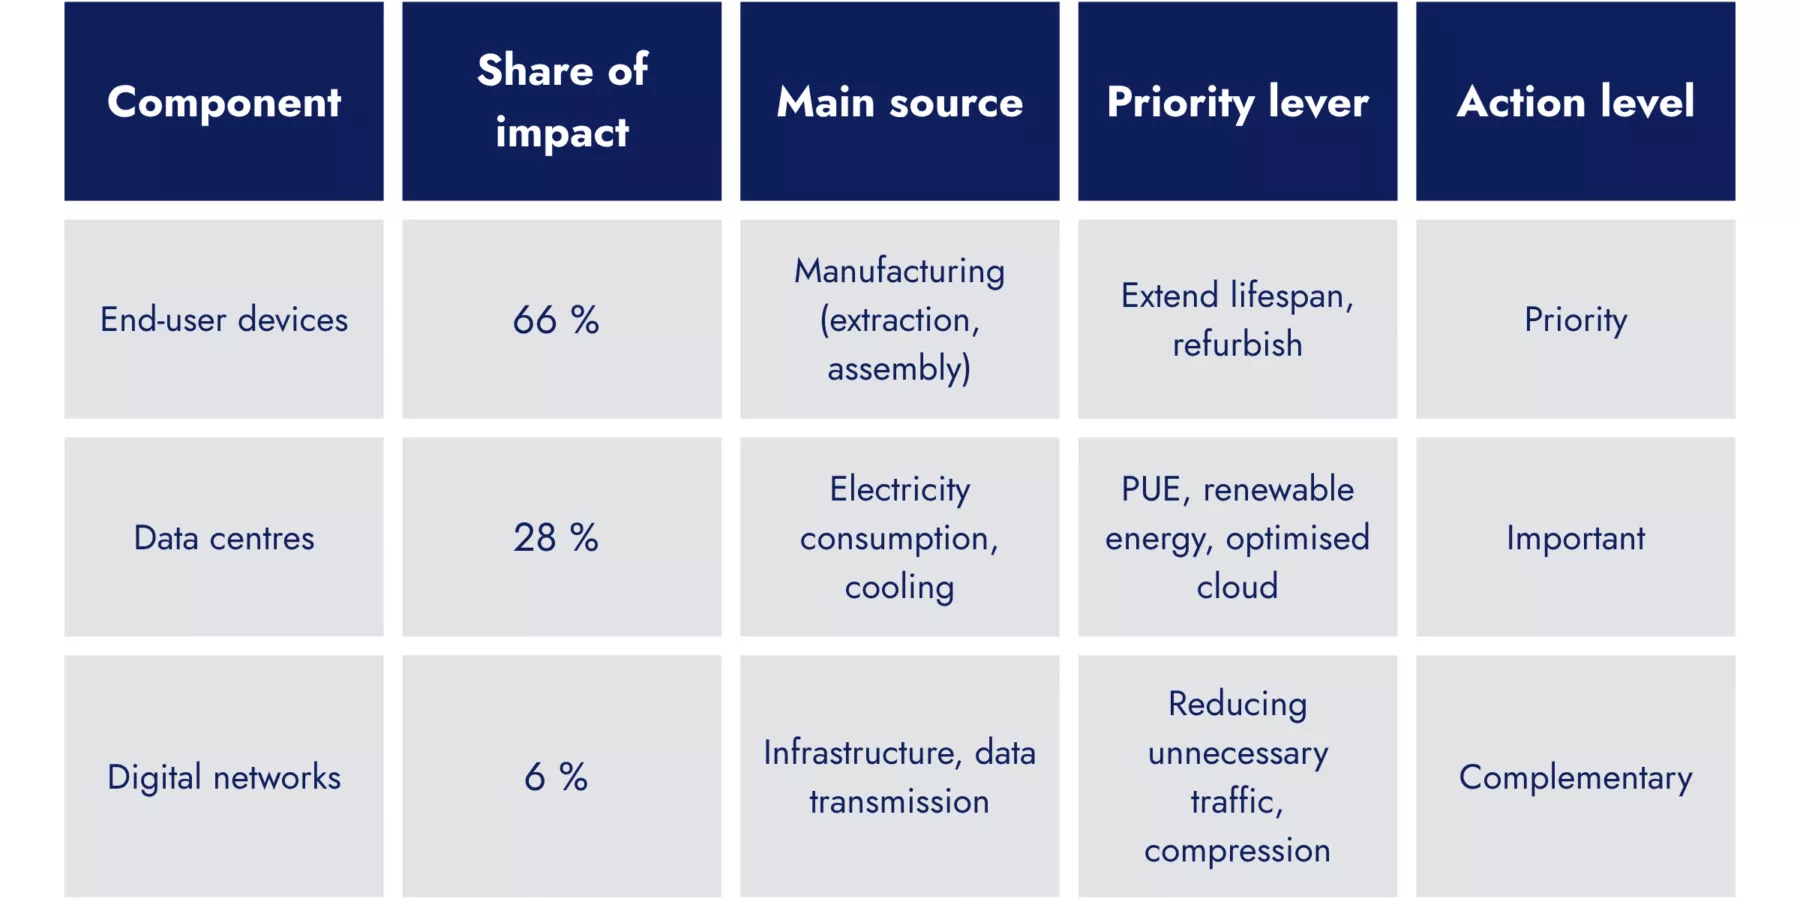
The manufacturing of digital devices (computers, smartphones, tablets, screens) is the main component, representing around 66% of the total impact in Switzerland. This is followed by data centres (28%) and digital networks (6%). This distribution explains why purchasing decisions and equipment lifespan policies are the most effective reduction lever.
How to measure and reduce the IT carbon footprint in a company?
The reference method is the life cycle assessment (LCA), which quantifies the impact of each piece of equipment over its entire life. In practice, the process begins with an inventory of the IT fleet, followed by the application of standardised emission factors (ADEME, ecoinvent database, manufacturer environmental declarations). Priority reduction levers are: extending equipment lifespan, integrating refurbished equipment, optimising data centres, and reducing unnecessary data flows. SPIE supports CIOs and CSR directors in this process with an LCA methodology based on the Resilio tool.
What are the impacts of data centres and end-user devices?
End-user devices currently account for 66% of the total digital footprint, mainly due to their manufacturing, which mobilises rare resources and generates a significant proportion of electronic waste. Data centres account for around 28%, an impact linked to their electricity consumption and cooling system, which varies greatly depending on the energy mix of the host country. Networks account for the remainder, around 6%.
This distribution is however set to evolve: according to the Resilio study (2025), data centres will become the largest contributor by 2035, driven by the explosion in cloud usage and the rise of generative artificial intelligence.
This is what justifies a dual priority: treating end-user devices as the immediate lever, while already anticipating the growing trajectory of cloud infrastructure.
Ready to measure your IT fleet's footprint?
The first step is a life cycle assessment of your infrastructure. SPIE supports you with an LCA methodology based on the Resilio tool, from the initial diagnostic to integration into your ESG dashboard.